How’s Business? Sharpen Your Response with KPIs
There’s no room for guesswork in today’s competitive world, and it’s critical to have a quick view of business dynamics as the strategic CFO. And when you’re talking to the board, there’s nothing like exuding confidence with all the relevant data at your fingertips. So to ensure that your software company is tracking towards performance metrics, follow these steps:
Start by defining the metrics that are important for your business. These should be specific, measurable, and relevant to your goals. Then, you can involve your team and stakeholders to get their input and buy-in. KPI metrics are essential for SaaS, e-commerce, mobile apps, and marketplace companies, to name just a few. This article includes the relevant metrics to include in your customized dashboard, and there’s a template attached for free.
Beat & Raise
“As a CEO, one of the best ways to gain inventors’ trust is by achieving your existing targets. Even better is demonstrating that you are exceeding your short-term targets and increasing mid-term targets. This is the startup’s version of “beat and raise.” Amit Karp, Partner at Bessemer Venture Partners, is fond of saying. This section is part of a larger series on budgeting which is a great read.
Ah, yes, the joy of beating and raising the outlook. I worked on Wall St before becoming an operational CFO and there’s nothing better than your stock going up 25% because of a positive earnings surprise. The targets are good, the outlook goes up, and everyone is happy. The flip side is when a company misses its earnings outlook…then it looks out below, and the stock will be in the penalty box for quarters to come.

So how does one reach that point of positive growth and surprise? The intro is the metrics that can display the trends and business dynamics to achieve the expectation-setting point.
The Right Targets & Milestones
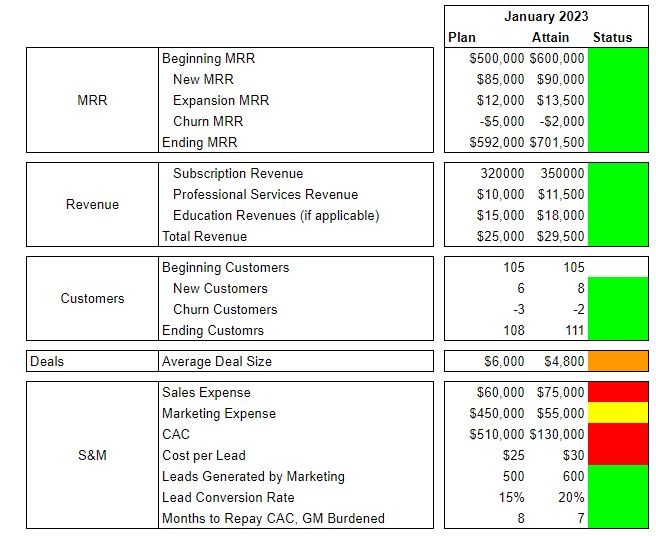
Once you have defined your metrics, set specific targets for each one, this will help you track your progress and identify areas where you need to improve. Your targets should be realistic, achievable, and challenging enough to motivate the team. We usually track metrics monthly and color code them as the business progresses to quickly see if we are ahead of plan (green), on plan (yellow), or something is not right (red). The data depends on your business and what you believe will help you drive the top line and margins. AirBnB, which is now $72B in market cap, likes to measure guest segments (for example 62% of AirBnB guests are 34 years old or younger.) They also measure uptake by geography as Asia Pacific at the moment is a growth area. I typically work backwards from what I want to achieve and then decide on the KPIs.

You can download this Google sheet KPI dashboard template (STRATIV KPI DASHBOARD TEMPLATE V1.0) to monitor metrics regularly. This will help you stay on top of your performance and identify any issues or trends that require your attention. Make sure that your data is accurate and up-to-date. Management should have access to this shared Google sheet dashboard so that everyone can see how business is trending during weekly leadership or staff meetings.

The data doesn’t lie. Use your metrics data to analyze your performance and identify areas for improvement. For example, if you are red in many regions, think about the targets for the month and the quarter and see if the numbers are realistic. If AEs are missing their targets, do a deeper analysis on why and what can be done to improve the top of the funnel for example. The message here is to course correct as needed based on your analysis. Regularly review your metrics and adjust your targets or strategies as required.
What should be in the dashboard?
Top Line and Growth. This section includes revenue growth, profit margins, and average revenue per user. For enterprise SaaS companies, I usually track attainment (downloaded from Salesforce.com) relative to our target for the quarter. Sometimes we build linearity for the quarters and add in bookings per month. It’s a nail-biter if you have the bulk of your business closed during the last month of the quarter, so try to push for better linearity if this box is glowing red.
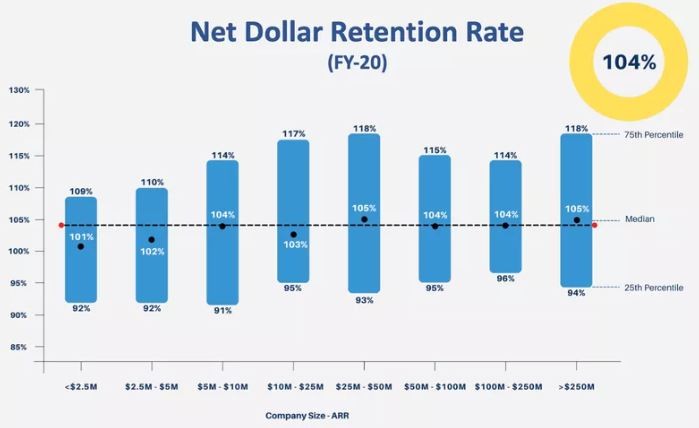
Customer Metrics: This includes metrics such as customer acquisition, customer retention, and customer satisfaction. The most crucial metric our prior CEO would point to is NDRR or Net dollar retention rate (NDRR). It’s a metric that includes many things in one formula and shows the rate at which existing customers spend more money on their products or services over time, net of any churn.
A quality company should strive for an NDR rate greater than 100%, meaning their existing customers spend more money with them than in the previous period, even after accounting for any revenue lost from churned customers. This indicates that the company is retaining and expanding its customer base and generating more revenue from existing customers, which is a crucial driver of long-term growth and profitability.

A high NDR rate over is a strong indicator of customer satisfaction and the value the company’s products or services provide to customers (this means your product is a must, not a nice one). It also reflects the effectiveness of the company’s customer success teams in driving upsell and cross-sell opportunities, as well as the stickiness of its products or services. For example, look at publicly traded companies such as SnowFlake (SNOW), DataDog (DDOG), or Crowdstrike (CRWD) and you will see an NDRR of over 130%.
Churn and the Pain of Losing a Customer
In our KPI dashboard, we closely monitor churn. Logo Churn is one thing, but dollar churn can be a bigger problem. Losing a small mid-market customer is one thing; losing a significant hospital or large enterprise will hurt quite a bit. So customer satisfaction or Net Promoter Scores are important in preventing potential churn.
Support Metrics: include response time, issue resolution, and customer feedback. My machine learning company had many customers flashing red, which we rapidly resolved proactively. The other thing is to ensure the data is correct and updated regarding customer satisfaction. The last thing you want is a “green” customer churn and surprise the senior management team (yes, I’ve seen this too).
Product Metrics: This includes metrics such as product usage, feature adoption, and product quality. For open-source companies, we track activity in the community, meetups, and anything that would be a precursor to future revenues, such as the growth of users for the free product.
Marketing Metrics: This includes website traffic, lead generation, and conversion rates. When I was the CFO of a software company, we pushed freemium a lot, so it was about tracking the trial requests and the velocity of trials from various marketing campaigns. If the solution is valuable and solves a user’s pain, make it simple to try the product and measure the conversion rate to a paid customer.
Employee Metrics: This includes metrics such as employee satisfaction, employee engagement, and employee retention. I also like to show headcount by region (US vs. International) and the number of quota-carrying AEs. Work with HR if you have one and include it as a monthly snapshot of employees’ performance.
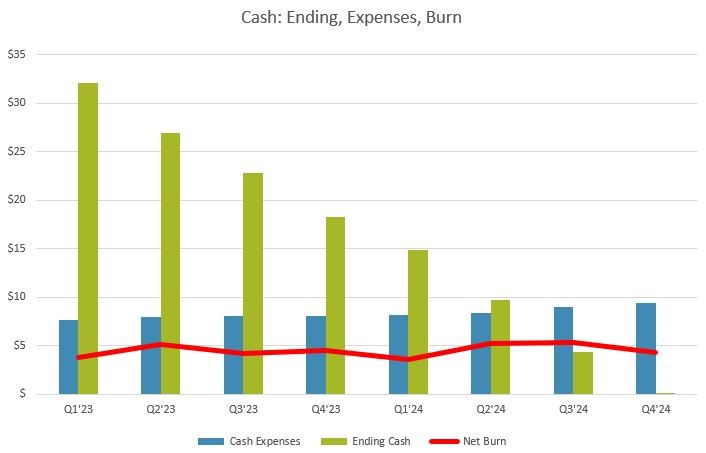
Financial Metrics: This is for the CFO or the VP of Finance and includes metrics such as cash flow, accounts receivable, and accounts payable. I also separate beginning cash, gross cash burn, net cash burn, and anything you collect from new and renewal customers. I typically have an open policy about the cash position so that all the company members act as shareholders and are mindful of expenses that impact the runway.

Objectives and Your Key Results. We won’t dive into OKRs in this series, yet the measure is precise, has metrics in place, and is working towards particular objectives and targets. By tracking the right KPIs, a software company can gain insights into its performance, identify areas for improvement, make better business decisions…and look good in front of its partners and the board.